Quickly Catch Concerns and Stay Safe with Q-Hazard Reporting

Empower Your Employees to Create a Culture of Safety

The Hazard Reporting Module empowers your team to report safety hazards promptly. It facilitates hazard identification, assessment, and mitigation to create a safer work environment for everyone.

SCHEDULE A DEMO
CONTACT US
Report, track, and prevent unsafe workplace condition right from Q-Hazard Reporting App

Hazard Reporting

Quantum’s Hazard Reporting module provides the following:

  • Ability to identify contributing causes of unsafe situations
  • Simple and user-friendly mobile app to encourage employees to remain engaged
  • Powerful and intuitive predictive analysis tools allowing managers to spot trends before a serious incident occurs

Value

  • Improve the effectiveness of safety programs through targeted intervention
  • Increase employee engagement and foster a culture of safety
  • Minimize administrative workload of safety personnel
  • Create continuous awareness to commit resources to safety by measuring ROI
  • All of which serve to increase efficiency and effectiveness of your company’s safety program.

Features

  • Mobile app for online and offline use
  • User defined factors (hazards, severity, causes)
  • Dashboard Reporting features
  • Perform calculation of safety metrics, cause analysis, and
    predictive analysis

How our Hazard Reporting solves those challenges

Data Gathering

Intuitive mobile app that:

  • all employees can access
  • collects descriptive data of each hazard

Results

  • Create a culture of safety awareness
  • Standardized and centralized observational data in a fully indexed and searchable database
  • Provide powerful and intuitive analysis tools to make informed decisions
  • Execute corrective actions to fix the root cause in a systematic manner
  • The ASSP’s (American Society of Safety Professionals) comprehensive survey and report analyzing the ROI
    for EHS management programs affirmed (most lately in 2019) the statistic that companies save $2-$6 for every $1 invested in tools to promote workplace health and safety.

Catch every concern and every benefit with Q-Hazard Reporting.

Mobilize your entire team by empowering every employee to report potential hazards and by gathering this data into one integrated database.

Q-Hazard Reporting App improves the safety of your workplace

Improve The Safety Of Your Workplace

by reducing the risk of injury, equipment breakage, and productivity loss with our software that allows you to identify trends with our predictive analysis tools before serious incidents occur.

Q-Hazard Reporting minimizes the administrative costs and stress

Minimize The Administrative Costs And The Stress

placed on safety managers with our Q-Hazard Reporting app. Enable all of your employees to become safety ambassadors, create accountability, and build a culture of safety.

Q-Hazard reporting makes smart corrective action plans

Take The Guesswork Out Of Making Corrective Action Plans

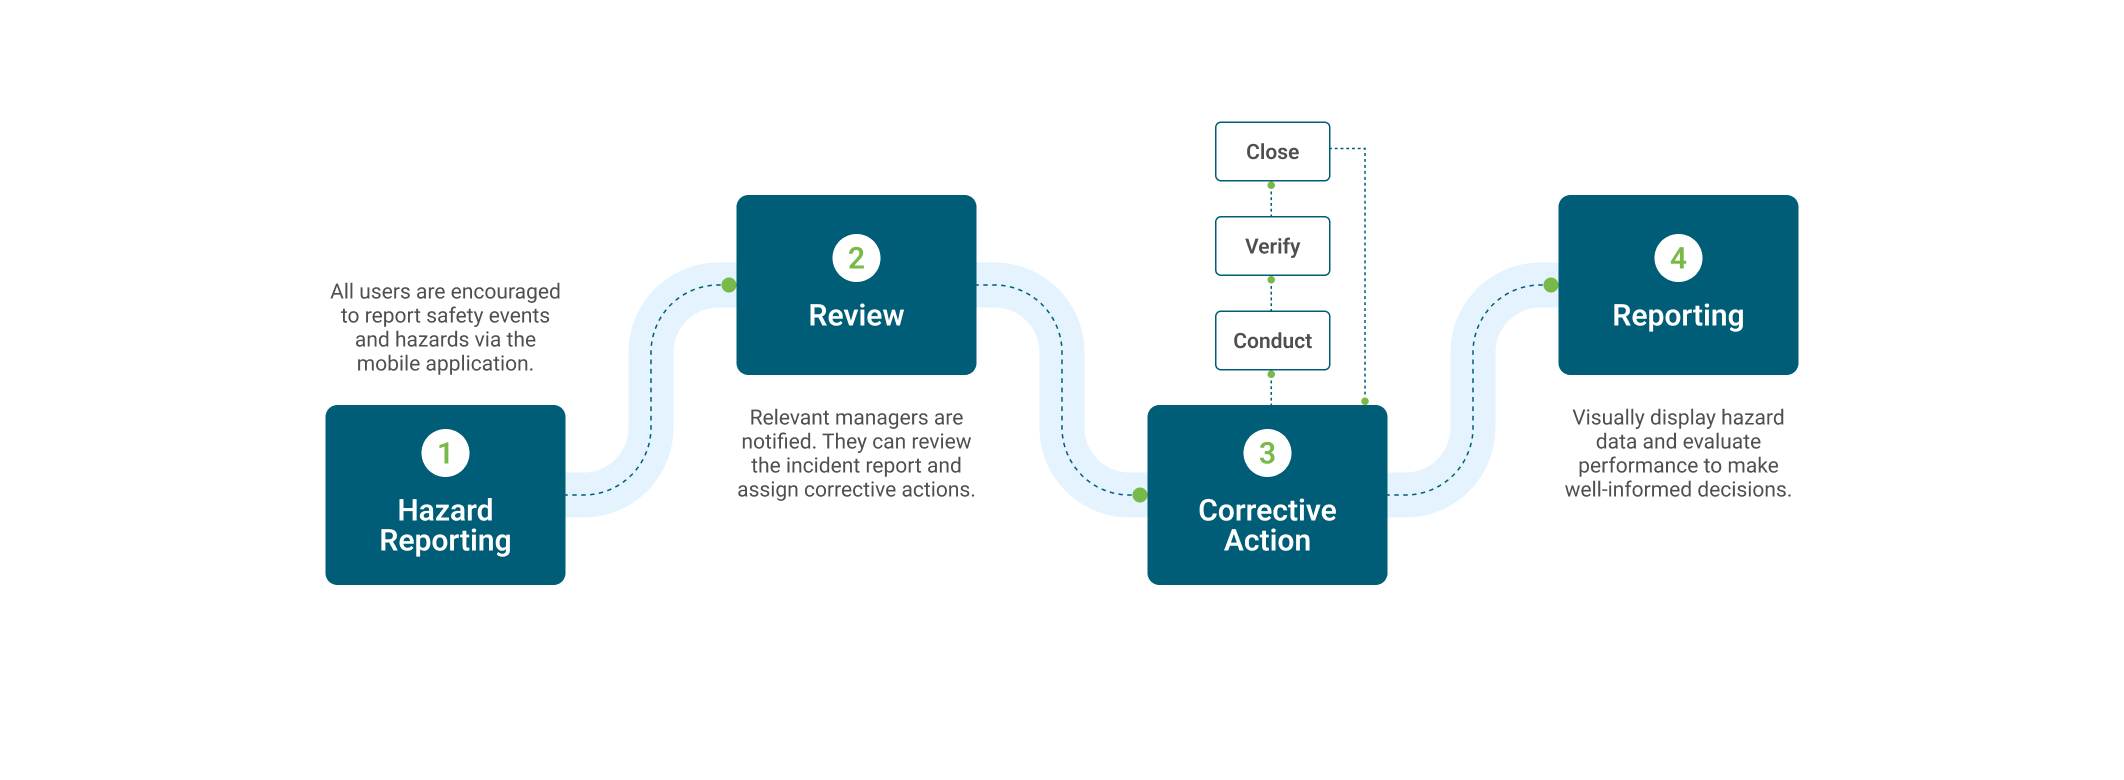
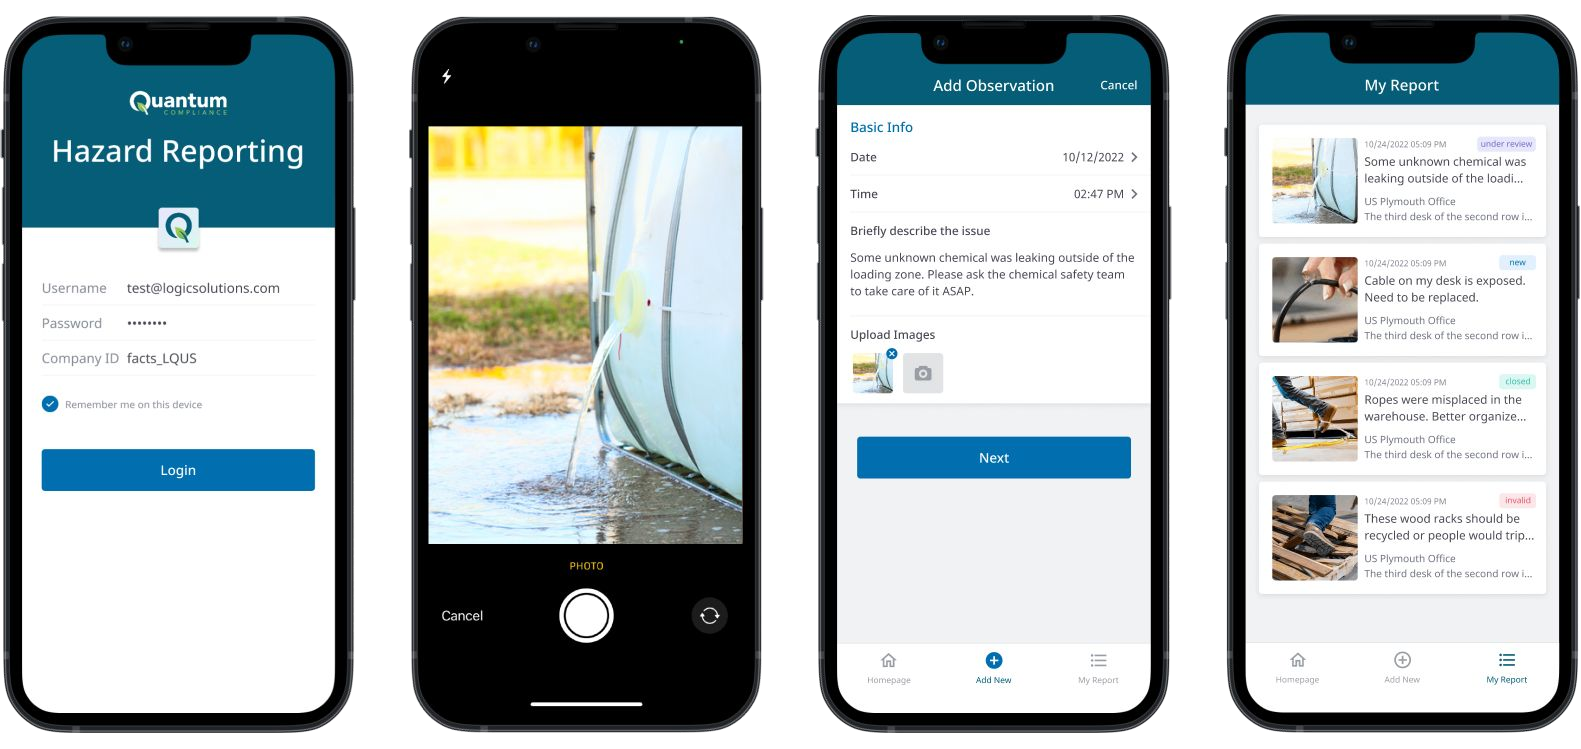
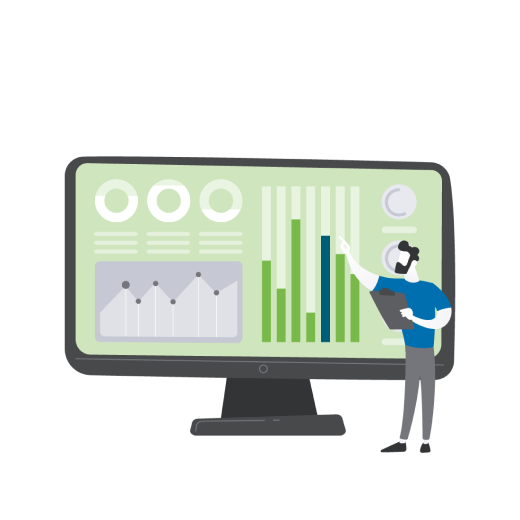
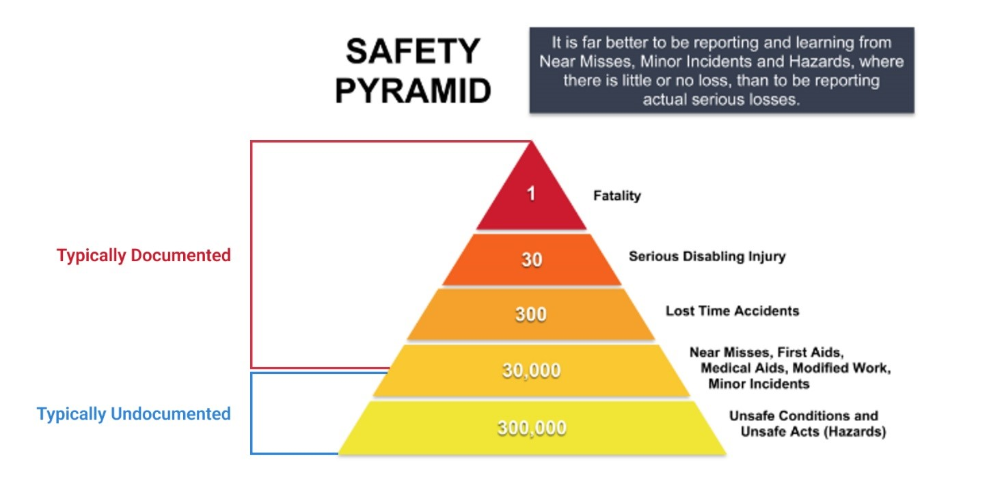
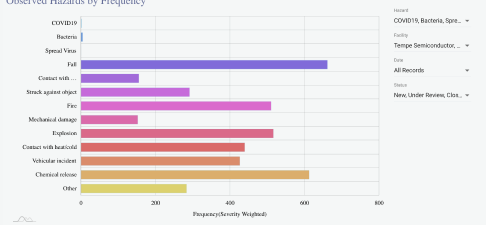
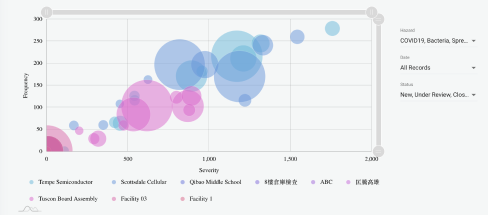
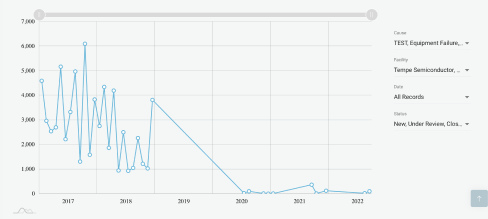
with our three dashboard reports that help your safety managers identify the causes, frequency, and severity of hazards. Plus, keep track of hazards at each location, the estimated expenses a hazard could cost the company, and whether or not corrective action plans have reduced the amount of reported incidents.

Q-Hazard Reporting app accesses data visualization report

Easily Access Standardized And Centralized Observational Data

in a fully indexed and searchable database. And gain a better understanding of where you should spend your time and resources such as on training or equipment. Plus, use our Q-Hazard Reporting app with third party reporting apps like Domo or Tableau.

Learn More

Quantum’s software is built with the Safety Pyramid at its core. This means that typically undocumented situations, at the bottom of the safety pyramid, will no longer slip through the cracks. With the Q-Hazard Reporting App, these seemingly smaller incidents can now be identified before they turn into serious hazards that can cause disabling injuries, property damage, and productivity loss.

Quantum safety pyramid

Here’s How the App Works

Once you download the app, log in with your credentials including username, password, and company ID.

Take a picture of the potential hazard, such as a chemical spill.

Briefly describe what you see.

Then click submit and notice that your observation has been recorded for your safety manager to review.

Learn More

Putting Data into Context with 3 Dashboard Reports for Safety Managers

Empowering your team to catch safety hazards before they happen

Prevent hazards by Frequency report

Observed Hazards by Frequency Report

The Observed Hazards by Frequency report allows safety managers to see how frequently hazards occur, the probable cause of the hazard, and the severity of both hazards and causes. This means that managers will be able to make more informed decisions and create better corrective plans that will prevent hazards.

The estimated risk exposure by hazard dashboard displays bubble charts.

Take The Guesswork Out Of Making Corrective Action Plans

The Estimated Risk Exposure by Hazard dashboard gives safety managers an overview of the company’s risk exposure by comparing all hazards at every location based on data from every recorded observation. In this report, the Y-Axis shows the frequency while the X-Axis shows the average severity. The various bubble colors represent the different locations that hazards occurred at and the size of the bubble represents the estimated cost the company could suffer from the hazard. Thus, Quantum allows managers to easily compare facilities to one another and displays what locations are dangerous and costly and which are safe.

Cause frequency over time charts helps managers analyze hazard causes and the results of corrective actions.

Cause Frequency Over Time chart

The Cause Frequency Over Time chart uses a month-to-month weighted cause frequency. The X-Axis portrays the passage of time while the Y-Axis shows the weighted frequency. This allows safety managers to analyze multiple hazard causes and see the impact of corrective actions. Therefore, managers can view whether or not corrective actions have worked or need to be changed.

LEARN MORE

Pricing

Q-Hazard Reporting App Pricing: only $90 per month with $0 set up fee. This plan includes unlimited users and one power user.

Learn more about Q-Hazard Reporting by visiting our blog section.

LEARN MORE
Workplace safety with Q-Hazard Reporting App
Contact Us
5/5 - (9 votes)