
Equip Every Employee to Communicate Potential Hazards From Their Cell Phone
Growing your safety culture requires daily focus and the participation of the entire team. Equipping your staff with the ability to “on the spot” document and communicate potential hazards, not only raises the level of organizational safety awareness but commissions every member of your team to be a safety ambassador by simply observing what is around them and signaling a possible problem for consideration.
Quantum’s Hazard Reporting software empowers your team to make a difference.

Q-Hazard Reporting Addresses The Safety Pyramid
Q-Hazard Reporting was developed based on the philosophy that if potential hazards are reported, this will raise awareness of conditions that could lead to actual incidents. Our software focuses on these “Unsafe Conditions” which are the base of what is known in the industry as The Safety Pyramid.
The Safety Pyramid was first proposed by workplace health pioneer, Herbert Heinrich some eighty years ago and is still a benchmark today. It states that there is a direct relationship between minor accidents, serious accidents, and near misses.
Source: https://inunison.io/stay-safe/stay-safe/near-miss-reporting-the-safety-pyramid-part-1/
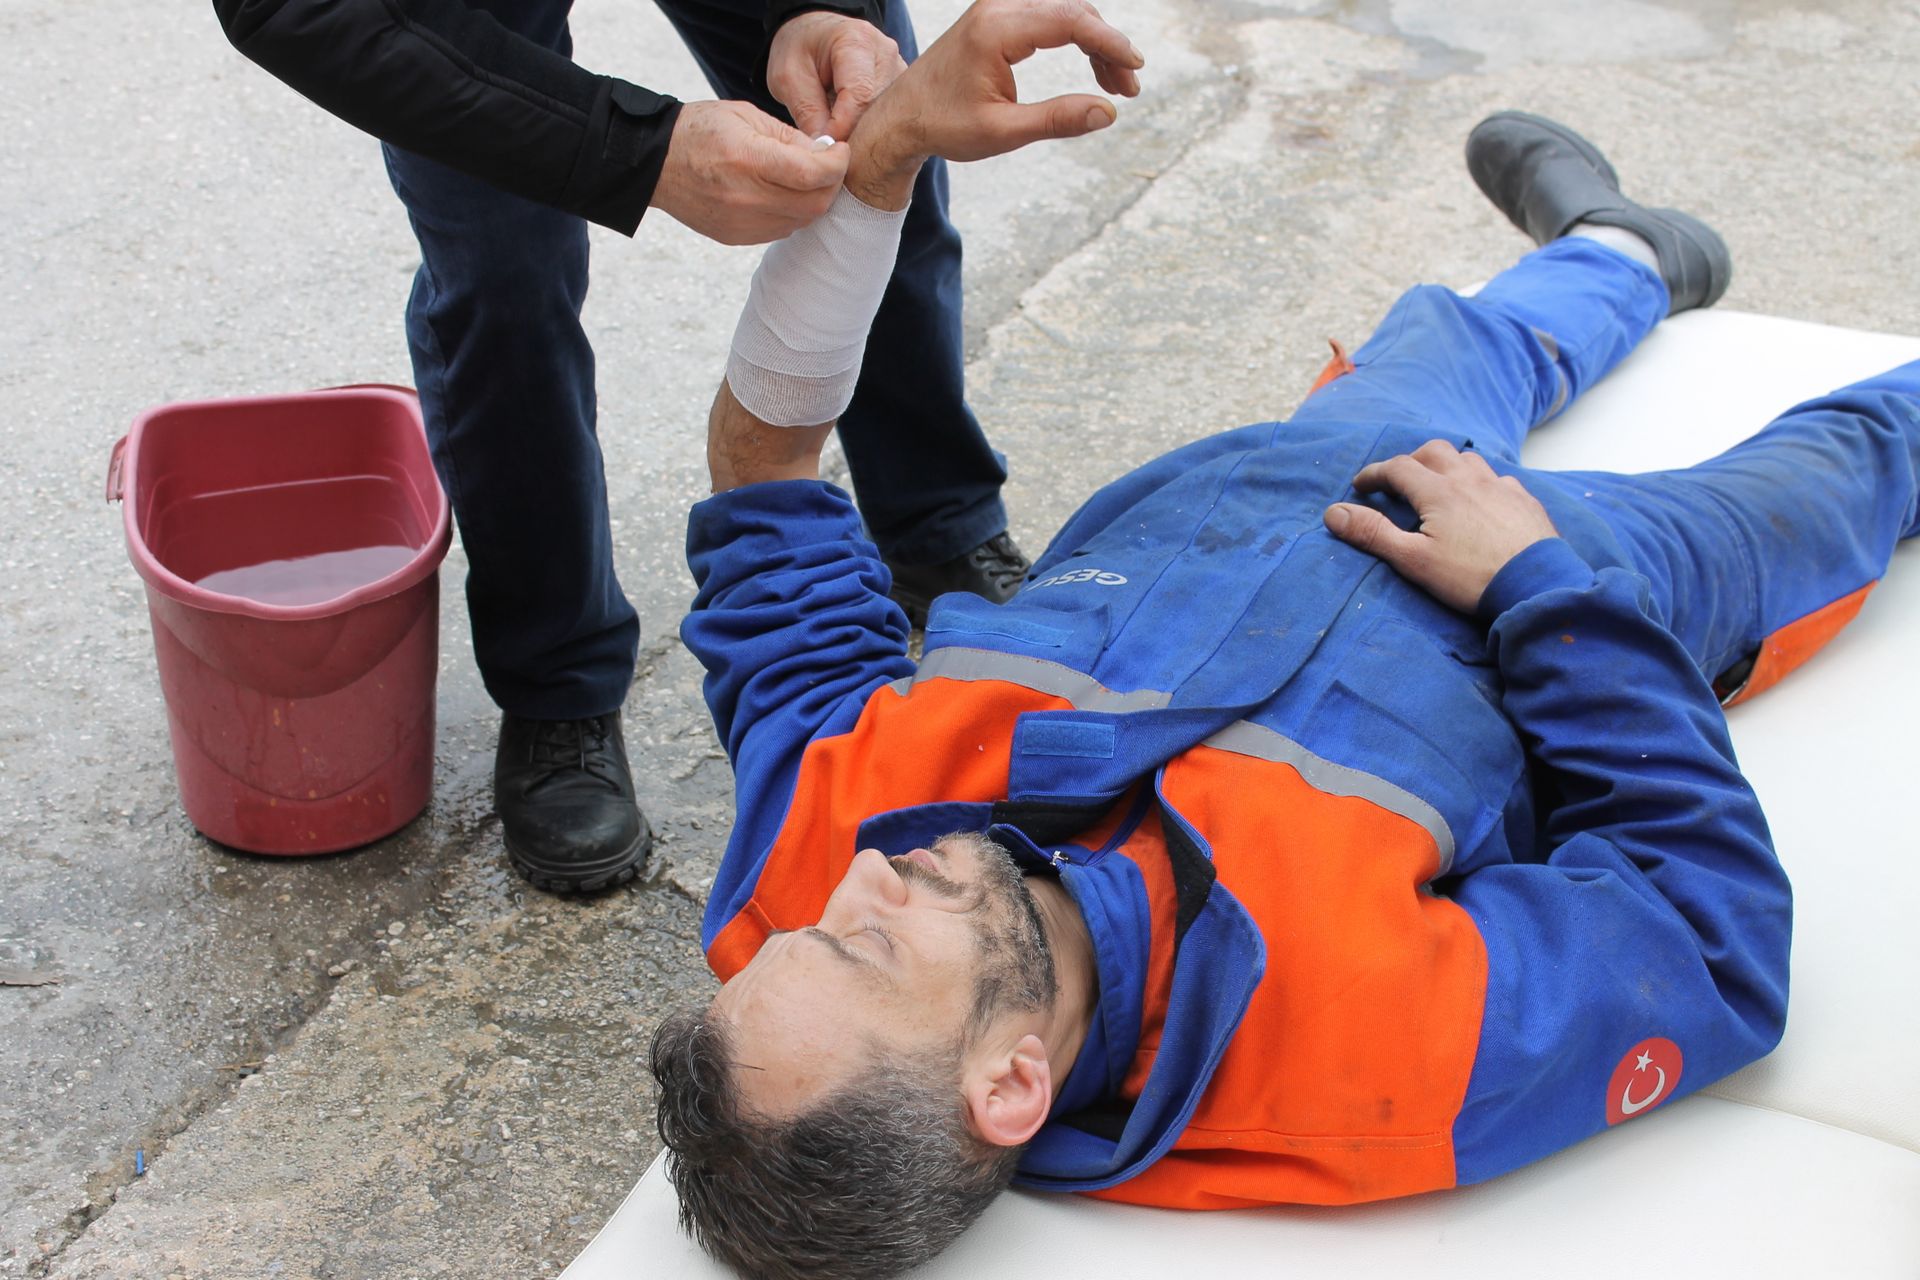
What is a near miss?
It’s an incident that would have resulted in a loss like an injury or property damage, only under slightly different circumstances. And an incident is an unwanted or unplanned event that could have or did result in a loss.
Why is this important?
The Safety Pyramid suggests that a majority of accidents can be prevented by acting on minor incidents and the behavior of employees. In other words, you need to detect safety issues, then plan safety measures, in order to prevent incidents, and protect your workers, customers, and company.
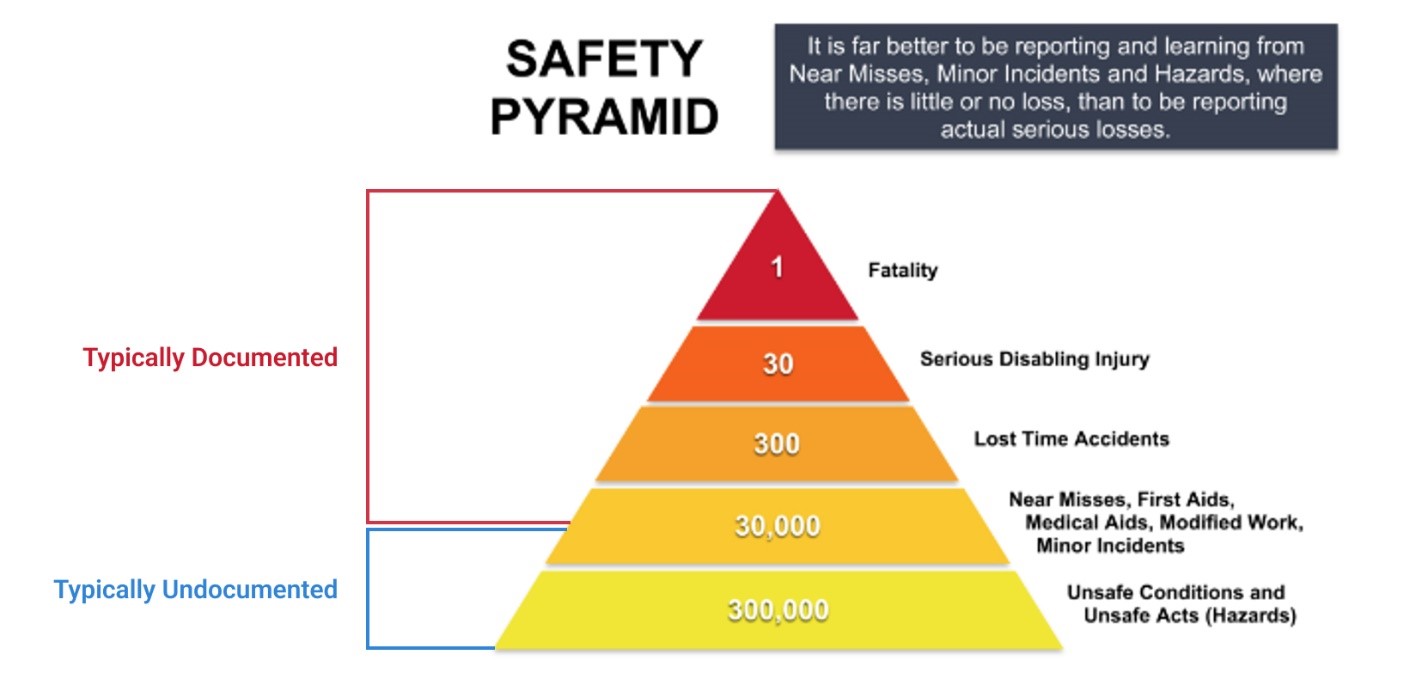
It’s important to note that the bottom portion of the Safety Pyramid is seldom reported, but Quantum’s software provides the solution to this by empowering all employees to report unsafe behaviors and hazards with the click of a button.
So, if a company can preemptively address potential hazards, it will reduce the likelihood of near misses. If near misses are reduced, then accidents and serious injuries will also be reduced or eliminated.
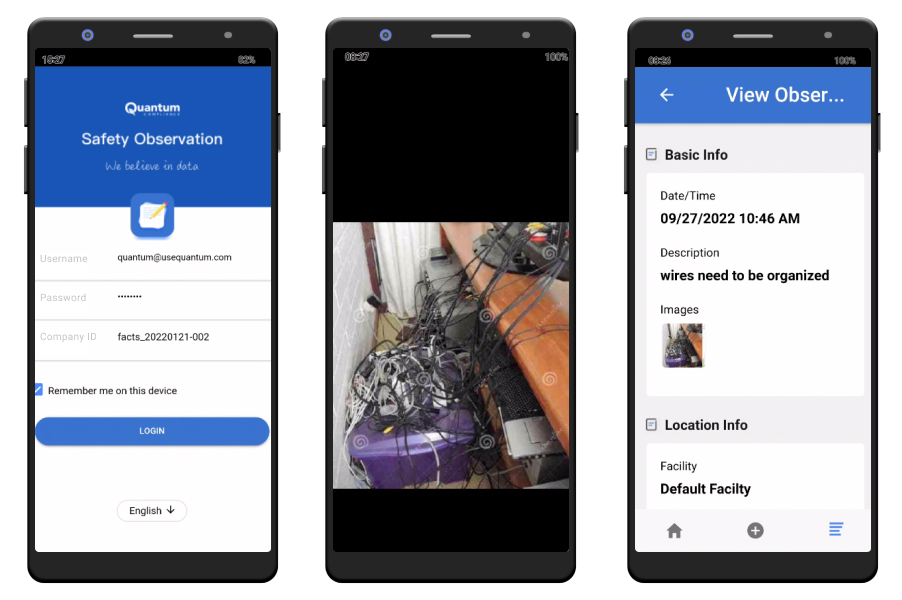
Here’s How The Tool Works
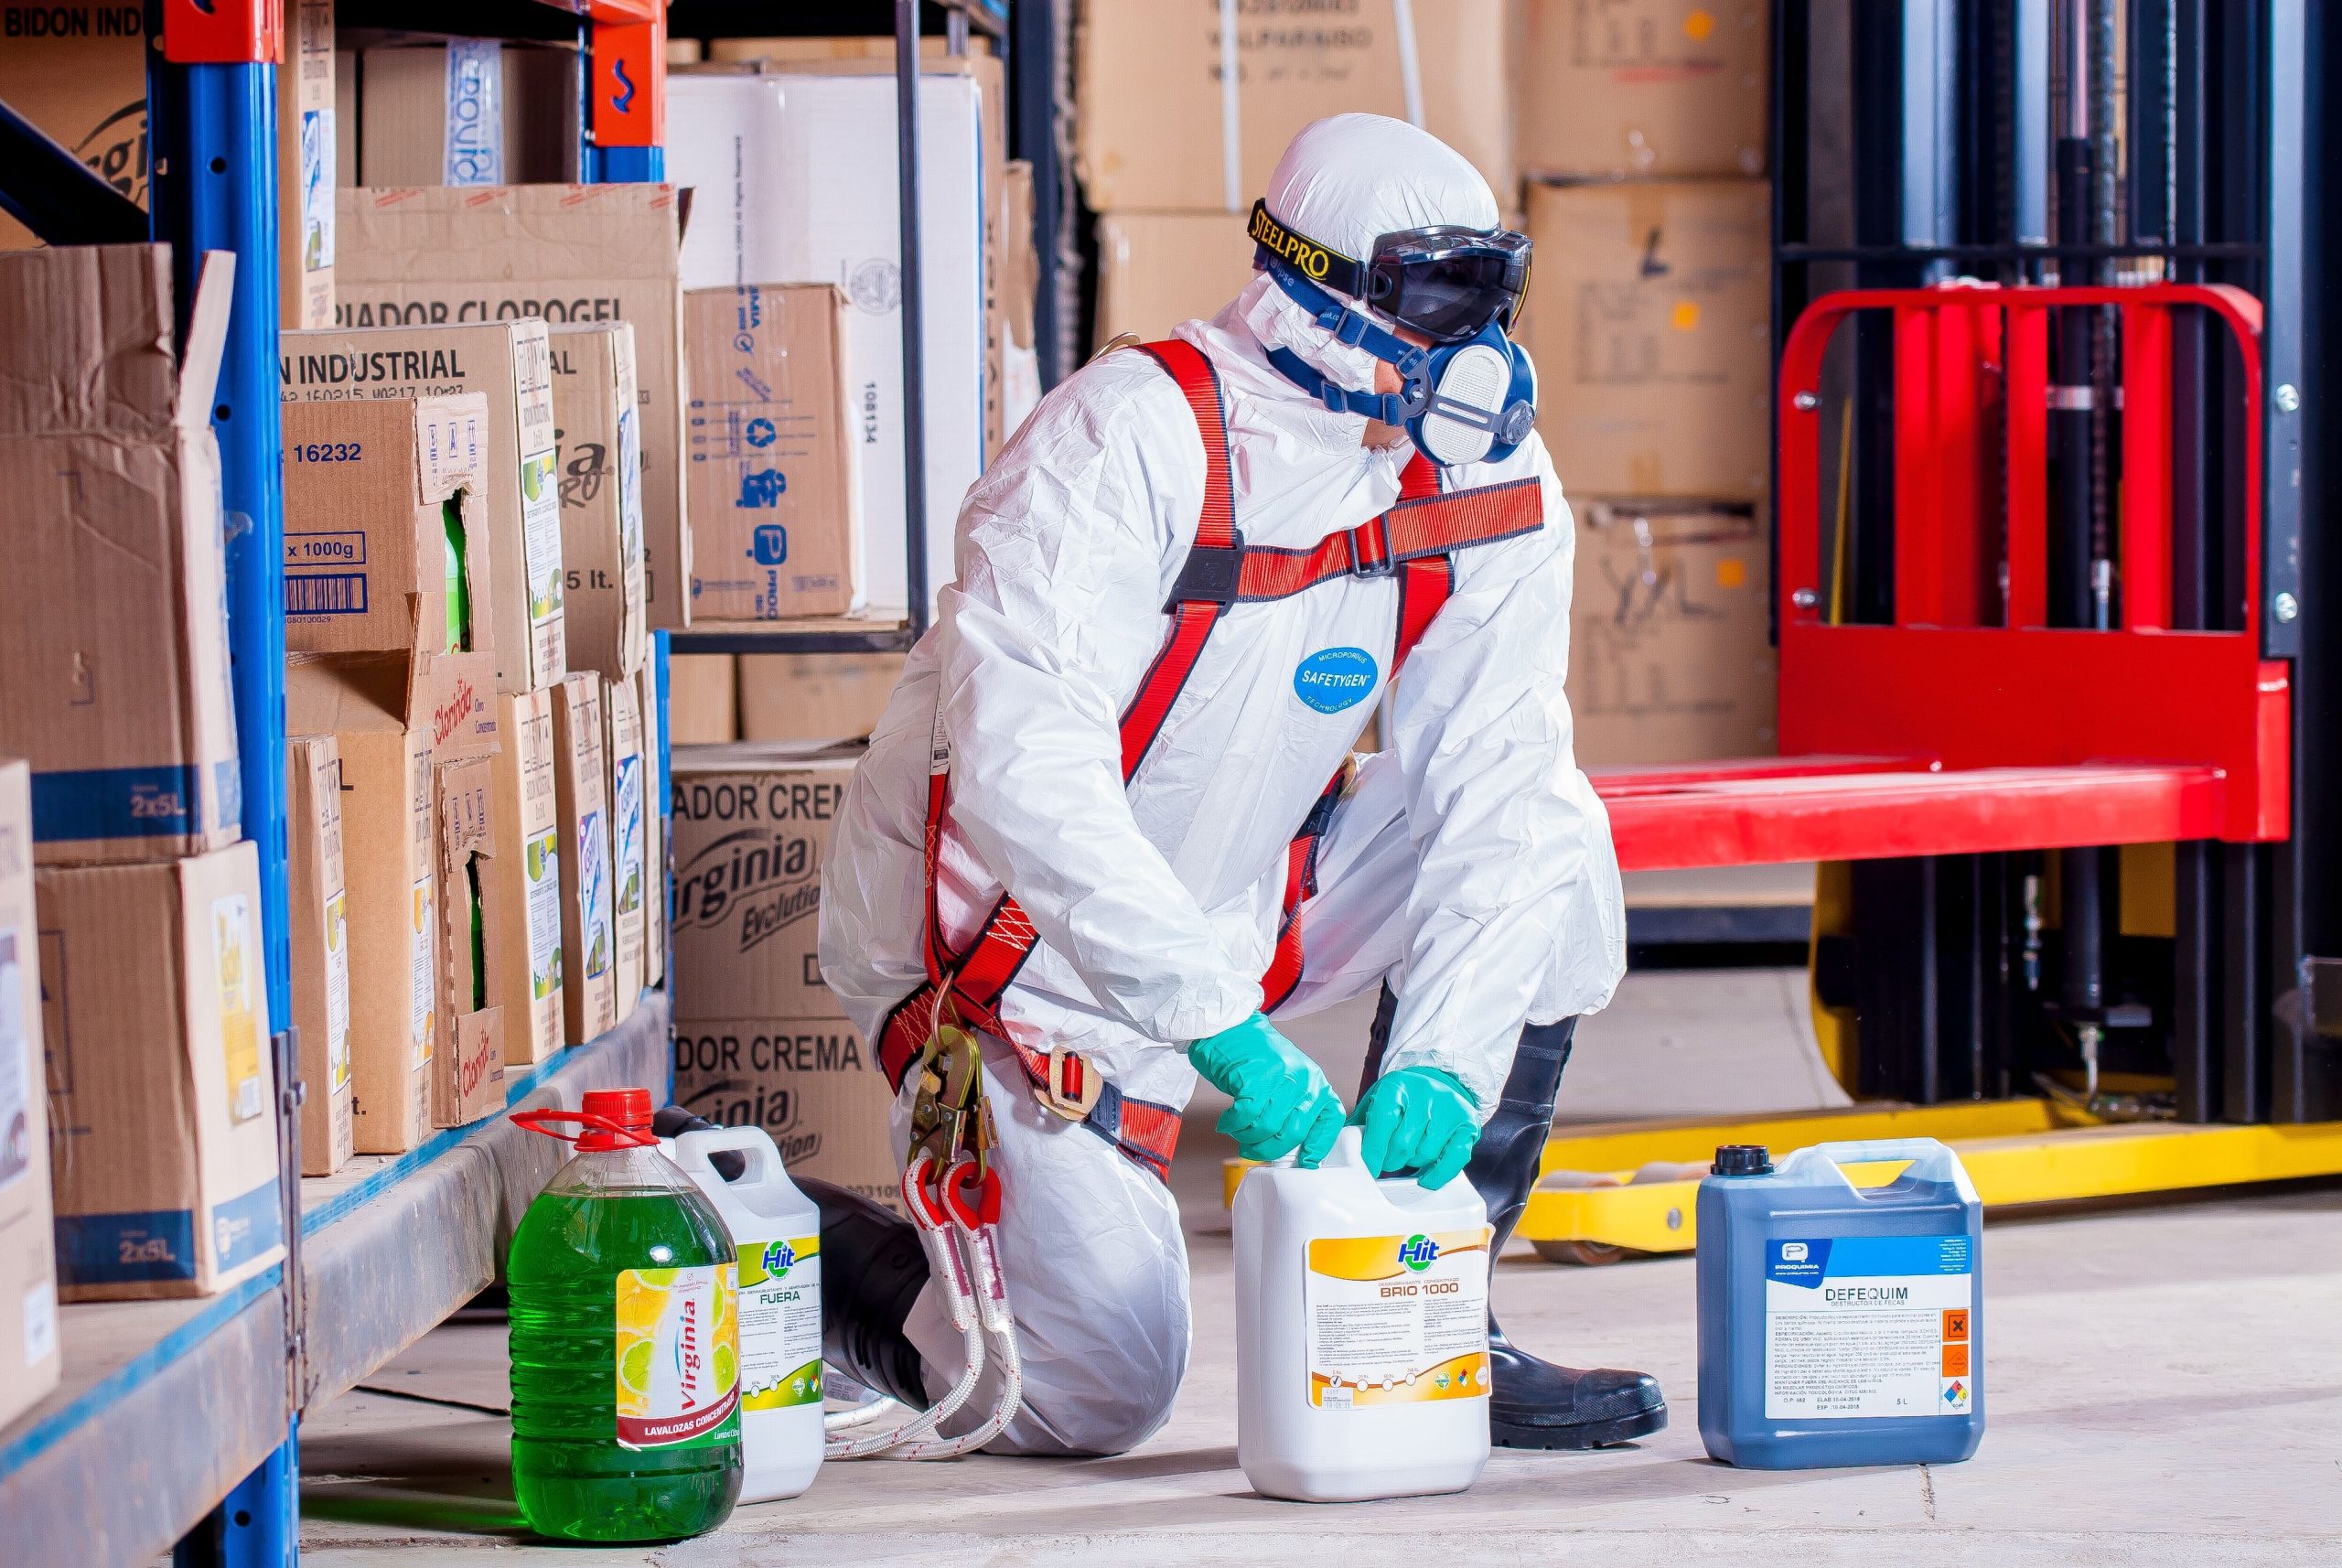
Every employee downloads the mobile app to their phone. The software comes with an unlimited number of users so there is no concern about the size of your organization. As your team members are going about their workplace duties, if they see a potential hazard—a loose wire, a tight Hi-Lo path, a slippery step—they can take a picture and send it to the database.
By reviewing these entries, safety managers can visualize the potential problem and decide what intervention should be taken to avoid safety issues. This equips you to build a strong database of what might be unsafe conditions and to be proactive in addressing them.
Quantum’s Dashboard Hazard Reports
Quantum’s software also collects near miss and actual incident data from employees and managers, who submit these occurrences via our mobile app. This information is then transformed into data analytics, which is compiled into reports that can be used to track and analyze safety hazards in the workplace. There are three key dashboard reports.
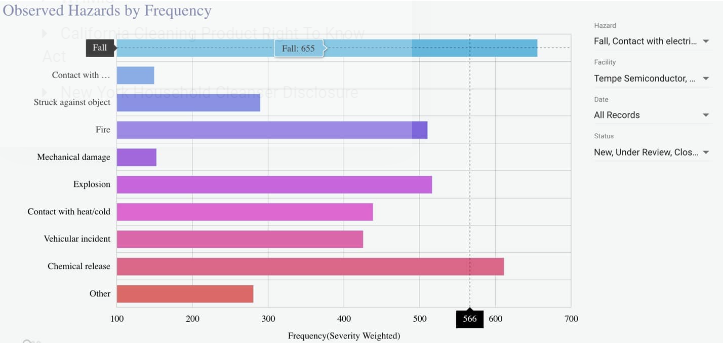
1) Observed Hazards by FrequencyThis report allows safety managers to see how frequently hazards occur, the probable cause of the hazard, and the severity of both hazards and causes. This means that managers will be able to make more informed decisions and create better corrective plans that will prevent hazards.
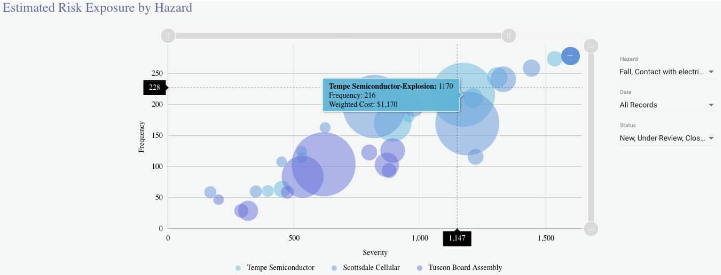
2) Estimated Risk Exposure by HazardThis second report gives safety managers an overview of the company’s risk exposure by comparing all hazards at every location based on data from every recorded observation. In this report, the Y-Axis shows the frequency while the X-Axis shows the average severity. The various bubble colors represent the different locations that hazards occurred at and the size of the bubble represents the estimated cost the company suffered. Thus, Quantum allows managers to easily compare facilities to one another and displays what locations are dangerous and costly and which are safe.
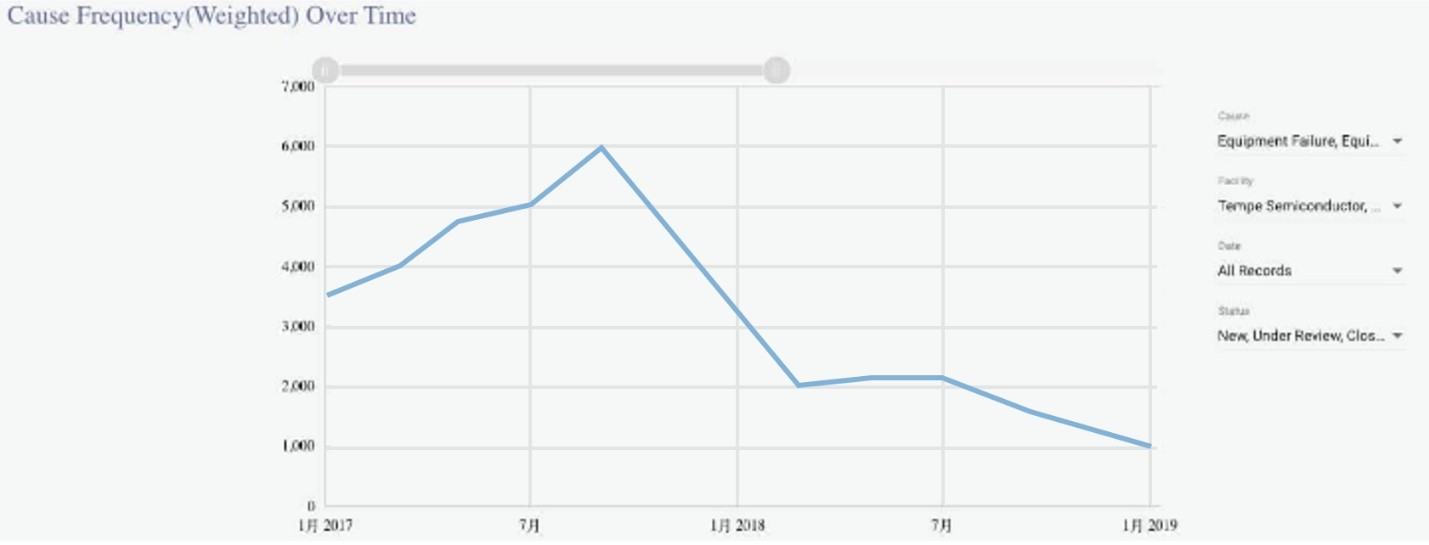
3) Cause Frequency Over TimeThe third report uses a month-to-month weighted cause frequency. The X-Axis portrays the passage of time while the Y-Axis shows the weighted frequency. This allows safety managers to analyze multiple hazard causes and see the impact of corrective actions. Therefore, managers can view whether or not corrective actions have worked or need to be changed.
Improve the results of your Safety Pyramid. Equip your team today with Q-Hazard Reporting from Quantum.