
The email from corporate lands on a Tuesday. A customer questionnaire needs your plant’s total recordable incident rate and DART rate for last calendar year, and they want both by Friday. You open the OSHA 300 log and count the rows in ten minutes. Then you get to the denominator and realize you don’t know which hours payroll will give you, or whether the forty agency temps on second shift belong in the total.
Both rates come from one formula that BLS and OSHA publish, and the arithmetic takes about a minute. Most of this guide covers the inputs.
The formula BLS and OSHA use
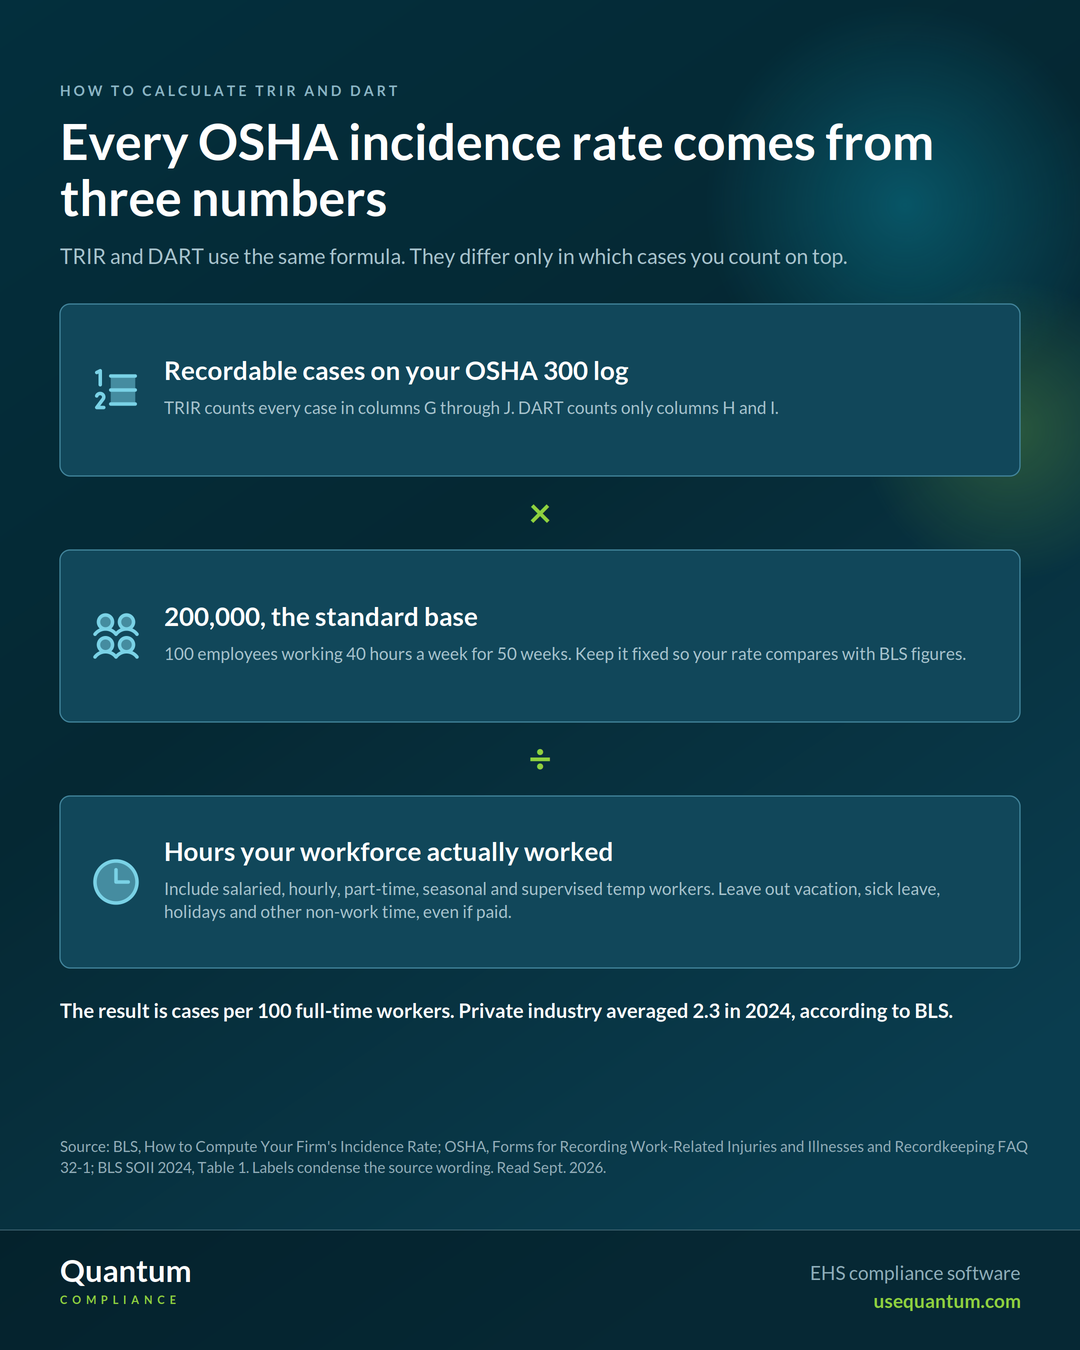
An incidence rate is the number of recordable cases multiplied by 200,000, divided by the hours all employees actually worked during the year. According to the Bureau of Labor Statistics, the 200,000 “represents the equivalent of 100 employees working 40 hours per week, 50 weeks per year,” so the result reads as cases per 100 full-time equivalent workers. That shared base is what lets a 60-person machine shop compare itself with a 3,000-person distribution center. OSHA’s recordkeeping FAQ says not to change the 200,000 if you plan to compare your rate with BLS industry rates, even when your headcount is small.
TRIR and DART use the same formula with different numerators. For TRIR, count every recordable case on the log for the year. For DART, OSHA’s recordkeeping forms package tells you to add the entries in column H (days away from work) and column I (job transfer or restriction). Column G (death) and column J (other recordable cases) count toward TRIR and stay out of DART. Because OSHA has you check only one box per case, for its most serious outcome, each case is counted once.
Steps to Calculate TRIR and DART From Your OSHA 300 Log
Confirm every case is entered and each has one outcome box checked in columns G through J.
All cases in G, H, I and J for TRIR. Only the cases in H and I for DART.
Include salaried, hourly, part-time and seasonal workers, plus agency workers your supervisors direct day to day. Exclude vacation, sick leave, holidays and any other non-work time, even if paid.
Cases x 200,000, divided by hours worked. Round to one decimal place when you compare with BLS tables, which report rates that way.
Use the BLS rate for your NAICS industry, and a size class or multi-year total if your site is small.
Getting the hours right
The hours figure is an easy place for errors to hide, often because of the report it comes from. Payroll systems are built to pay people. If your payroll export reports paid hours, it folds in holiday pay, vacation and sick time, which inflates the denominator and makes the rate look better than the floor earned. OSHA’s recordkeeping guidance on total hours worked is explicit: include hours worked by salaried, hourly, part-time and seasonal workers, and hours worked by other workers you supervise. The OSHA forms package names workers supplied by a temporary help service as an example. Leave out vacation, sick leave, holidays and any other non-work time, even when it was paid. If your records only capture paid hours, or your salaried staff don’t track time, OSHA says you must estimate the hours actually worked.
Agency labor produces the opposite error. When your supervisors direct a temp worker’s day-to-day work, OSHA says the records are kept by the firm responsible for that day-to-day direction, so the injury goes on your log and the hours belong in your total. Agency hours live in the staffing company’s invoices, so they are easy to miss. Drop them and the rate carries the temp’s injury in the numerator with none of the exposure in the denominator.
Take a hypothetical site with six recordable cases, three of them in columns H or I.
Same Six Cases, Three Different Denominators (Hypothetical Site)
| Hours used | Hours | TRIR | DART |
|---|---|---|---|
| Paid hours from payroll, no agency hours | 452,000 | 2.65 | 1.33 |
| Paid leave removed, still no agency hours | 421,000 | 2.85 | 1.43 |
| Hours worked, agency hours added | 465,000 | 2.58 | 1.29 |
Illustrative figures, shown to two decimals so the differences are visible. Formula and hours rules: OSHA Forms for Recording Work-Related Injuries and Illnesses and OSHA FAQ 32-1
The errors partly cancel on this site, so a rate that looks about right can still rest on wrong inputs. On another site with heavy agency use and little paid leave, the same mistakes could push the number a long way in either direction.
Comparing your rate to your industry
A TRIR only means something next to a benchmark from the same industry. BLS publishes rates by NAICS code every year from the Survey of Occupational Injuries and Illnesses, and the 2024 table shows how wide the spread is between sectors.
Total Recordable Case Rate by Sector, 2024
Cases per 100 full-time equivalent workers, private industry, calendar year 2024. Private industry total excludes farms with fewer than 11 employees.
Sector averages are a starting point. The same BLS table breaks rates down to four- and six-digit NAICS codes, and a plant should compare itself to the most specific code it can find. Across all of private industry, BLS reported a 2024 TRC rate of 2.3 cases per 100 FTE workers, down from 2.4 in 2023 and the lowest for the series going back to 2003. In BLS Table 1, the 2024 private industry DART rate was 1.4.
Small sites and one bad year
Take a site of about 45 people working roughly 90,000 hours a year. One recordable case produces a TRIR of 2.2. A second case doubles it to 4.4, and the site now matches the 2024 average for the entire transportation and warehousing sector with no change in its conditions. OSHA has acknowledged that a single case weighs far more on a small establishment’s rate, and it offers two remedies that keep the 200,000 constant. You can compare against BLS rates for your establishment size class, or enter three years of cases and three years of hours into the formula so a single year’s swing is smoothed out.
What to do before you send the number
- Fix the hours report at the source. Ask payroll or HR for a standing monthly report of hours worked that already excludes paid leave, so nobody has to correct paid hours by hand each January.
- Put agency hours on a schedule. Have each staffing agency send hours for workers your supervisors direct every month, in the same format as your own payroll data.
- Reconcile the log monthly. Review open cases and outcome columns while details are fresh. Some platforms now let a frontline worker report an injury by scanning a QR code and entering only an employee ID, with no app download or password, which shortens the gap between the event and the record.
- Send the inputs with the rate. Report the case count, hours, period covered, NAICS code and BLS comparison year alongside TRIR and DART, so whoever reads the number can check it.
- Treat a small-site rate as a trend. For sites with few cases, report the three-year rate next to the single year and explain the difference.
How Q-Incident Can Help
In the five-step calculation above, Q-Incident covers the case counts in step two and the TRIR arithmetic in step four. Each injured-person record carries a recordable flag that opens the OSHA 300 and 301 questions, and the 300, 300A and 301 forms export from those same records, so your case counts come straight from the incident data. The dashboard charts an incident rate trend per 100 FTE using the BLS formula, based on the working hours entered in the platform.
Which hours go into that figure, including agency labor, remains a payroll and HR decision that sits outside the platform. The dashboard also does not plot a BLS industry benchmark, so step five stays a manual comparison. To see how incident records, OSHA forms and the rest of your safety data fit on one EHS platform, contact sales@usequantum.com.